AIT Lablink Plotter Logo
latest

Installation

  • Maven
  • Building from source

Running the clients

  • Invoking the clients from the command line

Configuration

  • Overview
  • Client configuration
  • Input configuration
  • Plot configuration
  • Example configuration

Examples

  • Prerequisites
  • Example 1: Asynchronous plotter
  • Example 2: Synchronous plotter
AIT Lablink Plotter
  • AIT Lablink Plotter
  • Edit on GitHub

AIT Lablink Plotter

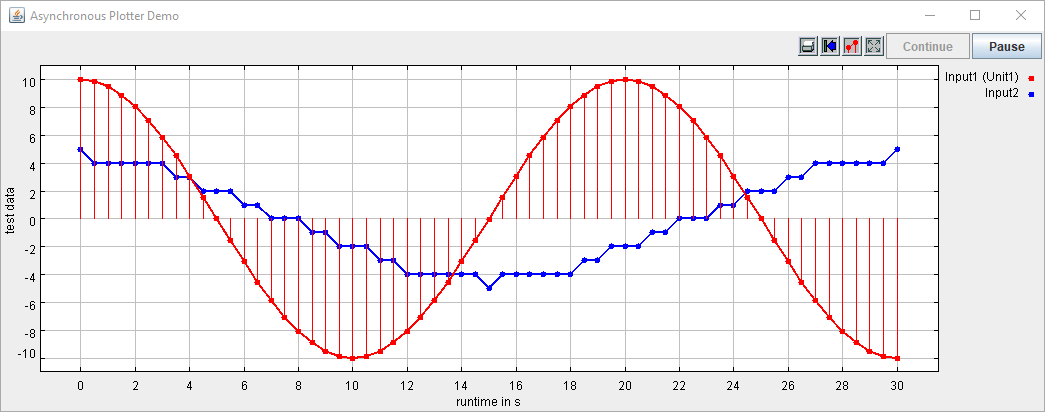
This package provides Lablink clients that visualize data as plotted graphs in a separate window. These plotted graphs are continuously updated while the client is running, showing the input data as a function of time.

The Lablink clients provided by this package are:

  • PlotterAsync: this client runs asynchronously and plots new data points as a function of wall-clock time

  • PlotterSync: this client runs synchronoulsy (i.e., synchronized by a sync host) and plots new data points as a function of synchronization time

Lablink plotter client.

Installation

Find information about the installation of the Lablink plotter clients here.

Running the clients

Find basic instructions for running the clients here.

Configuration

Find the reference for writing a configuration for a Lablink plotter client here.

Examples

Find step-by-step instructions for running the examples here.

Next

© Copyright AIT Austrian Institute of Technology GmbH. Revision 091cea4c.

Built with Sphinx using a theme provided by Read the Docs.