AIT Lablink Plotter
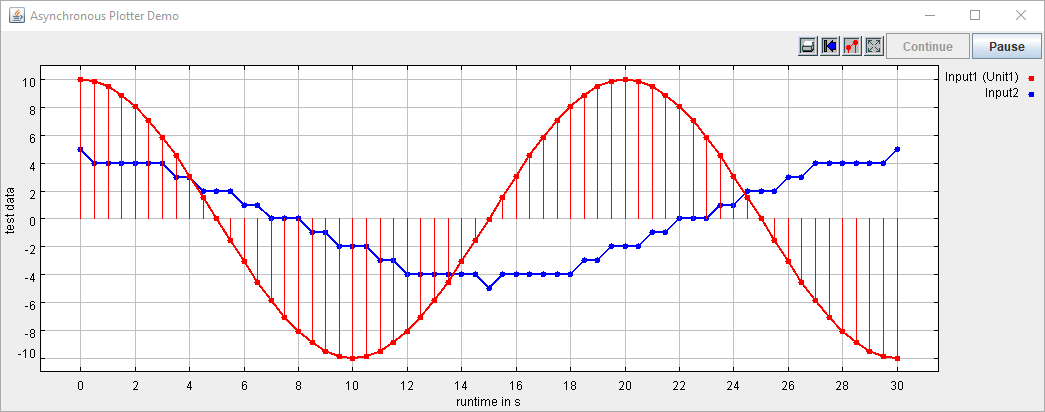
This package provides Lablink clients that visualize data as plotted graphs in a separate window. These plotted graphs are continuously updated while the client is running, showing the input data as a function of time.
The Lablink clients provided by this package are:
PlotterAsync: this client runs asynchronously and plots new data points as a function of wall-clock time
PlotterSync: this client runs synchronoulsy (i.e., synchronized by a sync host) and plots new data points as a function of synchronization time
Installation
Find information about the installation of the Lablink plotter clients here.
Running the clients
Find basic instructions for running the clients here.
Configuration
Find the reference for writing a configuration for a Lablink plotter client here.
Examples
Find step-by-step instructions for running the examples here.